Sunday, July 25, 2021

Three Triangles Patterns of Trading

A triangle is a chart pattern, depicted by drawing trendlines along a converging price range, that connotes a pause in the prevailing trend. Technical analysts categorize triangles as continuation patterns.

In technical analysis, a triangle is a continuation pattern on a chart that forms a triangle-like shape.

There are three triangle charts patterns:

  1.  Ascending Triangle
  2. Symmetrical Triangle
  3.  Descending Triangle                                                                                                                                                                                                                                                                                 The ascending triangle is a continuation pattern defined by an entry point, stop loss, and profit target. On the price chart, it appears as a horizontal support line connecting the highs to an upward moving trendline to the lows. Each ascending triangle has a minimum of two highs and two lows.

hh   

 Important Points of Ascending Triangle:

hh   Pattern type: Continuation

·         Indication: Bullish

·        Breakout confirmation: The confirmation for this pattern is a close above the highs on average trading volume.

·        Measuring: Subtract the height from the lowest low of the pattern and then added to the breakout level.

·    Volume: The volume declines throughout the ascending triangle formation, expanding when the breakout occurs.


The symmetrical triangle is a chart that can be recognized by its lower highs and higher lows. When two trend lines converge with the converging trend lines connecting and containing several peaks and troughs, then this pattern is indicated.


Important Points of Symmetric Triangle:

·         Pattern type: Continuation or reversal

·         Indication: Bullish or bearish

·     Breakout confirmation: The confirmation for this pattern is a close above or below the converging trend lines on above-average trading volume.

·     Measuring: subtract the height of the lowest low and the highest high of the pattern and then add or subtract this amount to the breakout level depending on which way the breakout moves.

·   Volume: The volume declines throughout the ssymmetrical triangle formation, expanding on the breakout.

hh


  j  The descending triangle pattern is a popular bearish continuation pattern that is created by drawing a horizontal line that connects low points and a trend line that connects lower highs. 


Important Points of Descending Triangle:

·         Pattern type: Continuation

·         Indication: Bearish

·        Breakout confirmation: The confirmation for this pattern is a close below the lows on above-average trading volume.

·       Measuring: Subtract the height from the highest highs and the low of the pattern and then subtracted from the breakout level.

·      Volume: The volume declines throughout the descending triangle formation, expanding on the breakout.


Happy Trading & Happy Investing

If any Doubt Msg me at this:- https://twitter.com/garimalakhotiya?s=03

Open Demat account:- https://zerodha.com/open-account?c=BY8956    

3)     

Wednesday, July 14, 2021

Tweezer Bottom and Inverted Hammer Candlestick Patterns

 Tweezer Bottom

The Tweezer Bottom candlestick pattern is a bullish reversal candlestick pattern that is formed at the end of the downtrend.

It consists of two candlesticks, the first one being bearish and the second one being bullish candlestick.

Both the candlesticks make almost or the same low.When the Tweezer Bottom candlestick pattern is formed the prior trend is a downtrend.

A bearish tweezer candlestick is formed which looks like the continuation of the ongoing downtrend. On the next day, the second day’s bullish candle’s low indicates a support level.

The bottom-most candles with almost the same low indicate the strength of the support and also signal that the downtrend may get reversed to form an uptrend. Due to this the bulls step into action and move the price upwards.

This bullish reversal is confirmed the next day when the bullish candle is formed.


Inverted Hammer

 Inverted Hammer is formed at the end of the downtrend and gives bullish reversal signal.

In this candlestick the real body is located at the end and there is long upper shadow. It is the inverse of the Hammer Candlestick pattern.

This pattern is formed when the opening and closing prices are near to each other and the upper shadow should be more than the twice of the real body.


Happy Trading & Happy Investing

If you have any Doubt Contact me: https://twitter.com/garimalakhotiya?s=03

Demat Account link: https://zerodha.com/open-account?c=BY8956    

Tuesday, July 13, 2021

Three Inside Up and Bullish Harami Candlestick Patterns

 Three Inside Up

The Three Inside Up is multiple candlestick pattern which is formed after a downtrend indicating bullish reversal.

It consists of three candlesticks, the first being a long bearish candle, the second candlestick being a small bullish candle which should be in the range the first candlestick.

The third candlestick should be a long bullish candlestick confirming the bullish reversal.


The relationship of the first and second candlestick should be of the bullish harami candlestick pattern.

Traders can take a long position after the completion of this candlestick pattern.


Bullish Harami

 The Bullish Harami is multiple candlestick chart pattern which is formed after a downtrend indicating bullish reversal.

It consists of two candlestick charts, the first candlestick being a tall bearish candle and second being a small bullish candle which should be in the range of the first candlestick.

The first bearish candle shows the continuation of the bearish trend and the second candle shows that the bulls are back in the market.


Traders can take a long position after the completion of this candlestick pattern.


Happy Trading & Happy Investing

If you have any Doubt Contact me on this: https://twitter.com/garimalakhotiya?s=03

Open the Demat Account: https://zerodha.com/open-account?c=BY8956    

Sunday, July 11, 2021

How to find Resistance and Support?

The support and resistance (S&R) are specific price points on a chart which are expected to attract maximum amount of either buying or selling. The support price is a price at which one can expect more buyers than sellers. Likewise the resistance price is a price at which one can expect more sellers than buyers.

The Resistance

Resistance is which stops the price from rising further. The resistance level is a price point on the chart where traders expect maximum supply (in terms of selling) for the stock/index. The resistance level is always above the current market price.

 Resistance is caused by heavy selling that overpowers buying and occurs at specific Resistance levels.

 The Support

Having learnt about resistance, understanding the support level should be quite simple and intuitive. As the name suggests, the support is that prevents the price from falling further. 

The support level is a price point on the chart where the trader expects maximum demand (in terms of buying) coming into the stock/index. 

Whenever the price falls to the support line, it is likely to bounce back. The support level is always below the current market price.

 Support is caused by heavy buying that overpowers selling and occurs at specific Support levels.

 IMPORTANT POINTS TO BE NOTED

Entry in Confirmation Candle means in next candle.

Do Price Analysis

Don’t do time analysis

Time Analysis do only for Scalp trading and Intraday Trading


Construction/Drawing of the Support and Resistance level

Here is a 4 step guide to help you understand how to identify and construct the support and the resistance line.

Step 1:- Load data points – If the objective is to identify short term S&R load at least 3-6 months of data points. If you want to identify long term S&R, load at least 12 – 18 months of data points. When you load many data points, the chart looks compressed.

 1. Long term S&R – is useful for swing trading

2. Short term S&R – is useful intraday and BTST(Buy Today and Sell Tomorrow) trades

Step 2:- Identify at least 3 price action zones – A price action zone can be described as ‘sticky points’ on chart where the price has displayed at least one of the behaviors:

1. Hesitated to move up further after a brief up move

2. Hesitated to move down further after a brief down move

3. Sharp reversals at particular price point


Step 3:- Align the price action zones – When you look at a 12 month chart, it is common to spot many price action zones. But the trick is to identify at least 3 price action zones that are at the same price level.


Step 4:- Fit a horizontal line – Connect the three price action zones with a horizontal line. Based on where this line fits in with respect to the current market price, it either becomes a support or resistance.


Happy Trading & Happy Investing

Query related message me on Twitter- https://twitter.com/garimalakhotiya?s=03

If you want to Open the Demat Account- https://zerodha.com/open-account?c=BY8956    


Friday, July 9, 2021

Three White Soldiers and White Marubozu Candlestick Patterns


Three White Soldiers:


The Three White Soldiers is multiple candlestick pattern which is formed after a downtrend indicating bullish reversal.


These candlestick charts are made of three long bullish bodies which do not have long shadows and open within the real body of the previous candle in the pattern.


White Marubozu:


The White Marubozu is a single candlestick pattern which is formed after a downtrend indicating bullish reversal.


This candlestick has a long bullish body with no upper or lower shadows which shows that the bulls are exerting buying pressure and the markets may turn bullish.


At the formation of this candle, the sellers should be caution and close their shorting position.


Happy Trading & Happy Investing

If any Query message me on Twitter- https://twitter.com/garimalakhotiya?s=03

Open Demat Account from this link- https://zerodha.com/open-account?c=BY8956    


Wednesday, July 7, 2021

Bullish Engulfing and Morning star candlestick pattern

Bullish Engulfing:


Bullish Engulfing is multiple candlestick chart pattern which is formed after a downtrend indicating bullish reversal.

It is formed by two candles, the second candlestick engulfing the first candlestick. The first candle being a bearish candle indicates the continuation of the downtrend.

The second candlestick is a long bullish candle which completely engulfs the first candle and shows that the bulls are back in the market.


Traders can enter a long position if next day a bullish candle is formed and can place a stop-loss at the low of the second candle.


The Morning Star:


The Morning Star is multiple candlestick charts pattern which is formed after a downtrend indicating bullish reversal.

It is made of 3 candlesticks, first being a bearish candle, second a doji and third being a bullish candle.

The first candle shows the continuation of the downtrend, the second candle being a doji indicates indecision in the market, and the third bullish candle shows that the bulls are back in the market and reversal is going to take place.

The second candle should be completely out of the real bodies of first and third candle.


Traders can enter a long position if next day a bullish candle is formed and can place a stop-loss at the low of the second candle.


Happy Trading & Happy Investing

How to see Candlestick Charts?


Candlestick charts were originated in Japan over 100 years before the West had developed the bar charts and point-and-figure charts. In the 1700s, a Japanese man known as Homma discovered that as there was a link between price and the supply and demand of rice, the markets also were strongly influenced by the emotions of traders.

A daily candlestick charts shows the security’s open, high, low, and close price for the day. The candlestick’s wide or rectangle part is called the “real body” which shows the link between opening and closing prices.

This real body shows the price range between the open and close of that day’s trading.

When the real body is filled, black or red then it means that the close is lower than the open and is known as the bearish candle. It shows that the prices opened, the bears pushed the prices down and closed lower than the opening price.

If the real body is empty, white or green then it means that the close was higher than the open known as the bullish candle. It shows that the prices opened, the bulls pushed the prices up and closed higher than the opening price.

The thin vertical lines above and below the real body is known as the wicks or shadows which represents the high and low prices of the trading session.

The upper shadow shows the high price and lower shadow shows the low prices reached during the trading session.


There are 30 types of Candlestick charts, but we discussed 2 candlestick in 1 blog

Hammer:

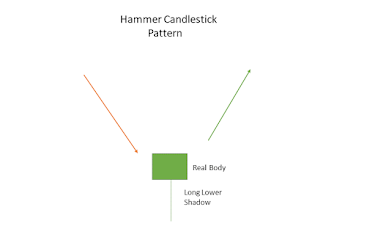
 Hammer is single candlestick pattern which is formed at the end of a downtrend and signals bullish reversal.

The real body of this candle is small and is located at the top with a lower shadow which should be more than twice of the real body. This candlestick chart pattern has no or little upper shadow.

The psychology behind this candle formation is that the prices opened and seller pushed down the prices.

Suddenly the buyers came into the market and pushed the prices up and closed the trading session more than the opening price.


This resulted in the formation of bullish pattern and signifies that buyers are back in the market and downtrend may end.

Traders can enter a long position if next day a bullish candle is formed and can place a stop-loss at the low of Hammer.

Piercing Pattern:


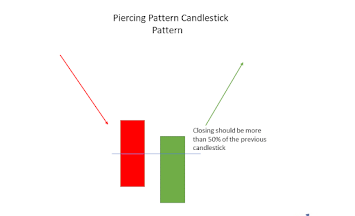
Piercing pattern is multiple candlestick chart pattern which is formed after a downtrend indicating bullish reversal.

It is formed by two candles, the first candle being a bearish candle which indicates the continuation of the downtrend.

The second candle is a bullish candle which opens gap down but closes more than 50% of the real body of the previous candle which shows that the bulls are back in the market and a bullish reversal is going to take place.


Traders can enter a long position if next day a bullish candle is formed and can place a stop-loss at the low of the second candle.


Happy Trading & Happy Investing

https://twitter.com/garimalakhotiya?s=03

https://zerodha.com/open-account?c=BY8956   

How to Draw Demand and Supply Zone

Supply and Demand Zones are chart areas with concentrated buying or selling interest. Buyers Create Demand zones, while Sellers create Suppl...